
Query Function Logs outside of your customer's subscription
tagged: terraform, Azure, node
 Thanks to @imranbangash for making this photo available freely on unsplash 🎁
Situation: Could not query function app logs inside customer's subscription.
Action(s): Wrote code and tinkered around in Azure portal: created a Diagnostic Setting that made function app logs available in Azure Monitor, used @azure/monitor-query to query the function logs
Result: No more relying on alert emails when Function App throws an exception 🥳
The Problem - Impaired/Nonexisting Function App Visibility
Well, we'd got a few customers to try out our company's IaaC offering. Woohoo! I should write more about how we're managing it sometime. Maybe next post.
During a few of our "privileged cloud" deploys, I discovered a wildly inconvenient issue with our ability to query function logs.
Our deploys consist of a two-step process:
- we have the customer create a susbcription and a service principal with full Owner permissions;
- we ingest the service principal credentials into our terraform, which provisions all the resources inside of the sub;
- after provisioning is complete, we have some lightweight bootstrap-style scripts and some database seeding.
One crucial thing to note is that we do not have console access to the subscription inside of which we are deploying. This means that we cannot view our function app logs inside the Azure portal. And we don't ship them outside of the customer's subscription for security purposes.
While we don't have console access, we do have azure cli access via the service principal creds. For a while the only way we could query function logs was to do soemthing greasy like this via the cli:
$ az monitor app-insights query --app Product-AppInsights --analytics-query 'exceptions | where timestamp < ago(10min)' --resource-group Product-RG
This technically works, but the response is JSON-formatted, which is no bueno for terminal readability. The schema of the response looks like this:
{
  "tables": [
    {
      "columns": [
        {
          "name": "timestamp",
          "type": "datetime"
        },
        {
          "name": "problemId",
          "type": "string"
        },
        ...
        {
          "name": "itemCount",
          "type": "int"
        },
        {
          "name": "_ResourceId",
          "type": "string"
        }
      ],
      "name": "PrimaryResult",
      "rows": []
    }
  ]
}
Perhaps there's a way to nicely format the results here (neither table nor tsv output format flag attempts returned anything), but I couldn't find it.
To make matters even less observable, for some of our "privileged cloud" customers, the monitor exception does not seem to work at all (if you know what I mean when I say "privileged cloud" it's understandable).
We do have Action Alert emails set up, so when the Function App's exceptions table gets a record inserted into it, we know. Ideally though, we'd find out before the error arises, and when it happens, all we can do is restart the function app via cli and hope the problem goes away. No bueno.
The Solution Part One - Diagnostic Settings
So, what we decided to do was leverage an existing dashboard-style web app with some querying capabilities, allowing us to query the function app logs and format the response in a very pretty manner. This works because:
- the web app runs from inside the customer's subscription
- does not violate the rule of no-log-shipping
- it's javascript, so there's probably a way to do what I want, right?
First step is getting the function logs queryable. You can query them from the Functions Resource Pane in the Portal, but nowhere else. Which is a problem, because there's no programmatic paved road for querying the Function Logs via the Function Resource Pane. No npm package, particularly for our concern.
TBH I don't understand all the nuances here, but in a nutshell, Azure has a Monitoring Service and a Logs Service. There is some overlap between the two, but for some reason Function Apps aren't considered first-class citizens in either of these. So, for example, I can query any VM or custom logs via Log Analytics, but this is not the case with Function Logs.
In fact, without some special tweakin' the Function Logs aren't even queryable via Application Insights. But fortunately for our purposes, there is some special tweakin', in the form of a Diagnostic Setting. A Diagnostic Setting is simply an export/collection rule that makes the function logs visible in a few different places. Here's what the setting looks like in ye olde portal:
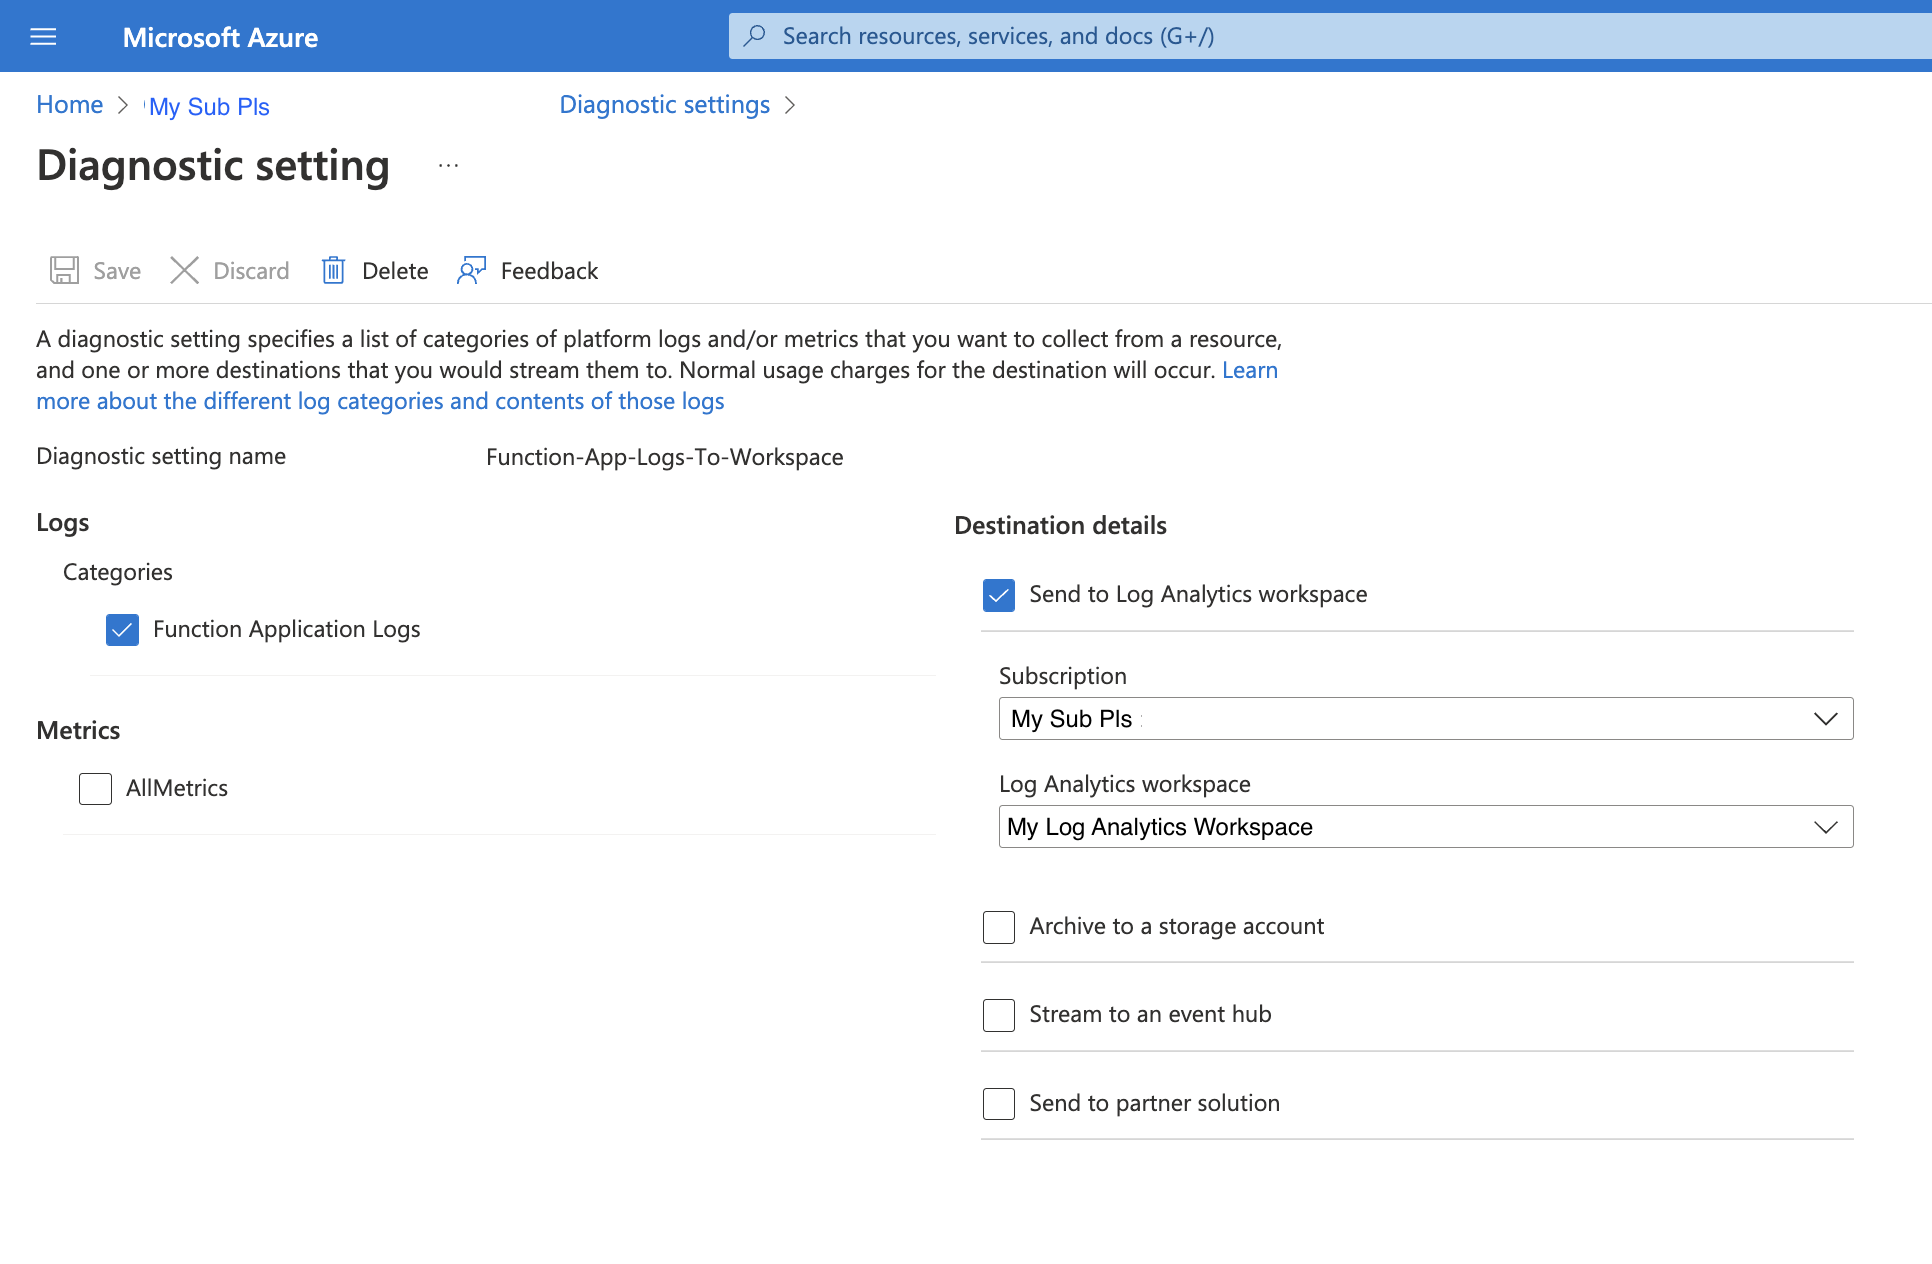
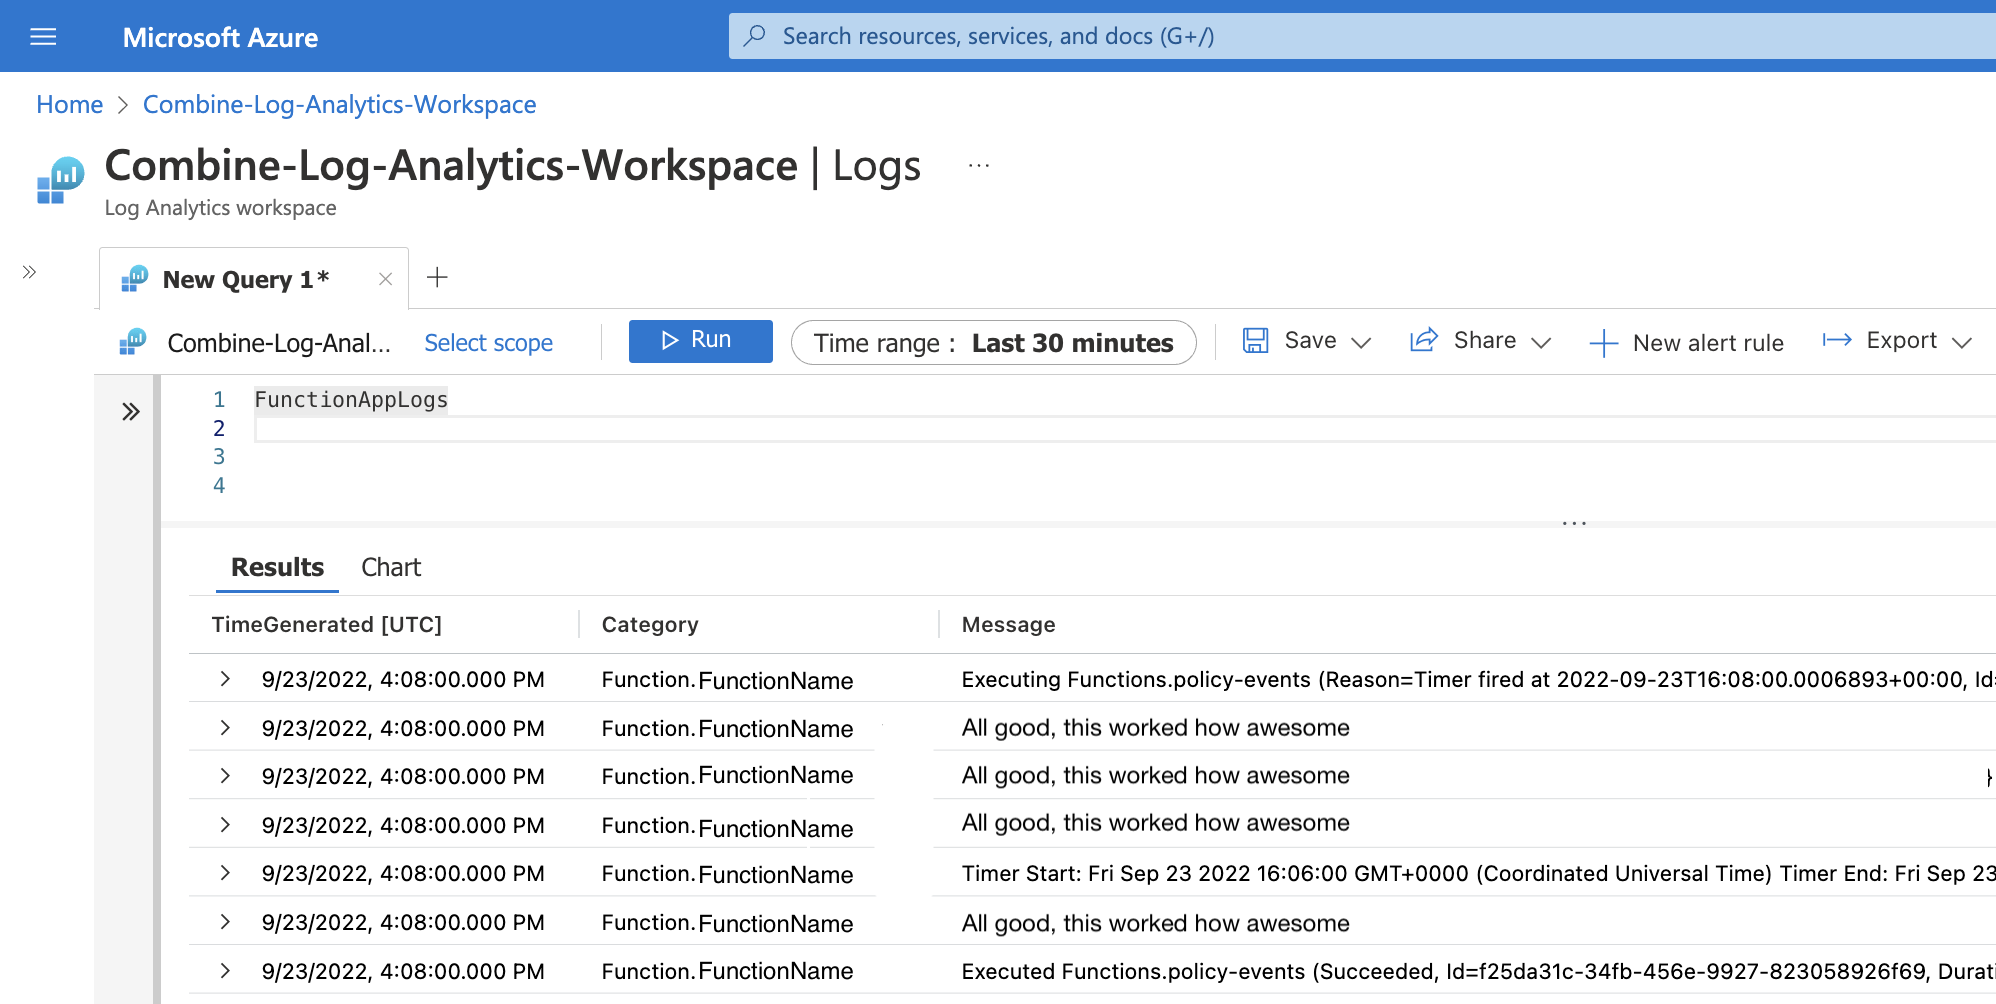
After adding this setting, the Function App Logs are available in Application Insights via the FunctionAppLogs table. Woohoo!
Great! Now that we have the infra end set up, we can do some frontend tweakin'.
The Solution Part Two - @azure/monitor-query
Application Insights is somehow integrated into Azure Monitor, which is great because we can use @azure/monitor-query to query the function logs from inside our dashboard web app!
Their docs there are pretty good, so I won't try to reproduce their stuff. It's pretty straightforward.
In our dashboard (written in Angular) we exposed an API endpoint /functionQuery that takes in a query querystring parameter (so Meta), then uses the package's LogsQueryClient to execute the query remotely on the Log Analytics Workspace. The docs for the package give a nice little processTables() helper method that prettifies the output from the client. Nice.
So, in our web app we have what looks like this:
this.messageRouter.get('/functionQuery', async (req: Request, res: Response) => {
  const query = (req.query.query as string)// may do some sanitizing on this

  const credential = new DefaultAzureCredential() // default credz for local devz

  const logsQueryClient = new LogsQueryClient(credential)

  const result = await logsQueryClient.queryWorkspace(process.env.AZURE_LOG_ANALYTICS_WORKSPACE_ID, query, {
    duration: Durations.thirtyMinutes
  })

  let prettyResponse = ''
  if (result.status === LogsQueryResultStatus.Success) {
    const tablesFromResult: LogsTable[] = result.tables

    if (tablesFromResult.length === 0) {
      this.logger.log(`No results for query '${query}'`)
      return
    }
    this.logger.log('This query has returned table(s) - ')
    prettyResponse = await this.processTables(tablesFromResult)
  } else {
    this.logger.log(`Error processing the query '${query}' - ${result.partialError}`)
    if (result.partialTables.length > 0) {
      this.logger.log('This query has also returned partial data in the following table(s) - ')
      prettyResponse = await this.processTables(result.partialTables)
    }
  }

  console.log('prettyResponse is: ' + prettyResponse)
  res.status(200).jsonp({
    response: prettyResponse
  })
})
Note that the above code is a rough first draft, hence the 200 for every response. I was so excited to have gotten this working that I did not make the code pretty first.
And here's what we have on the web app:
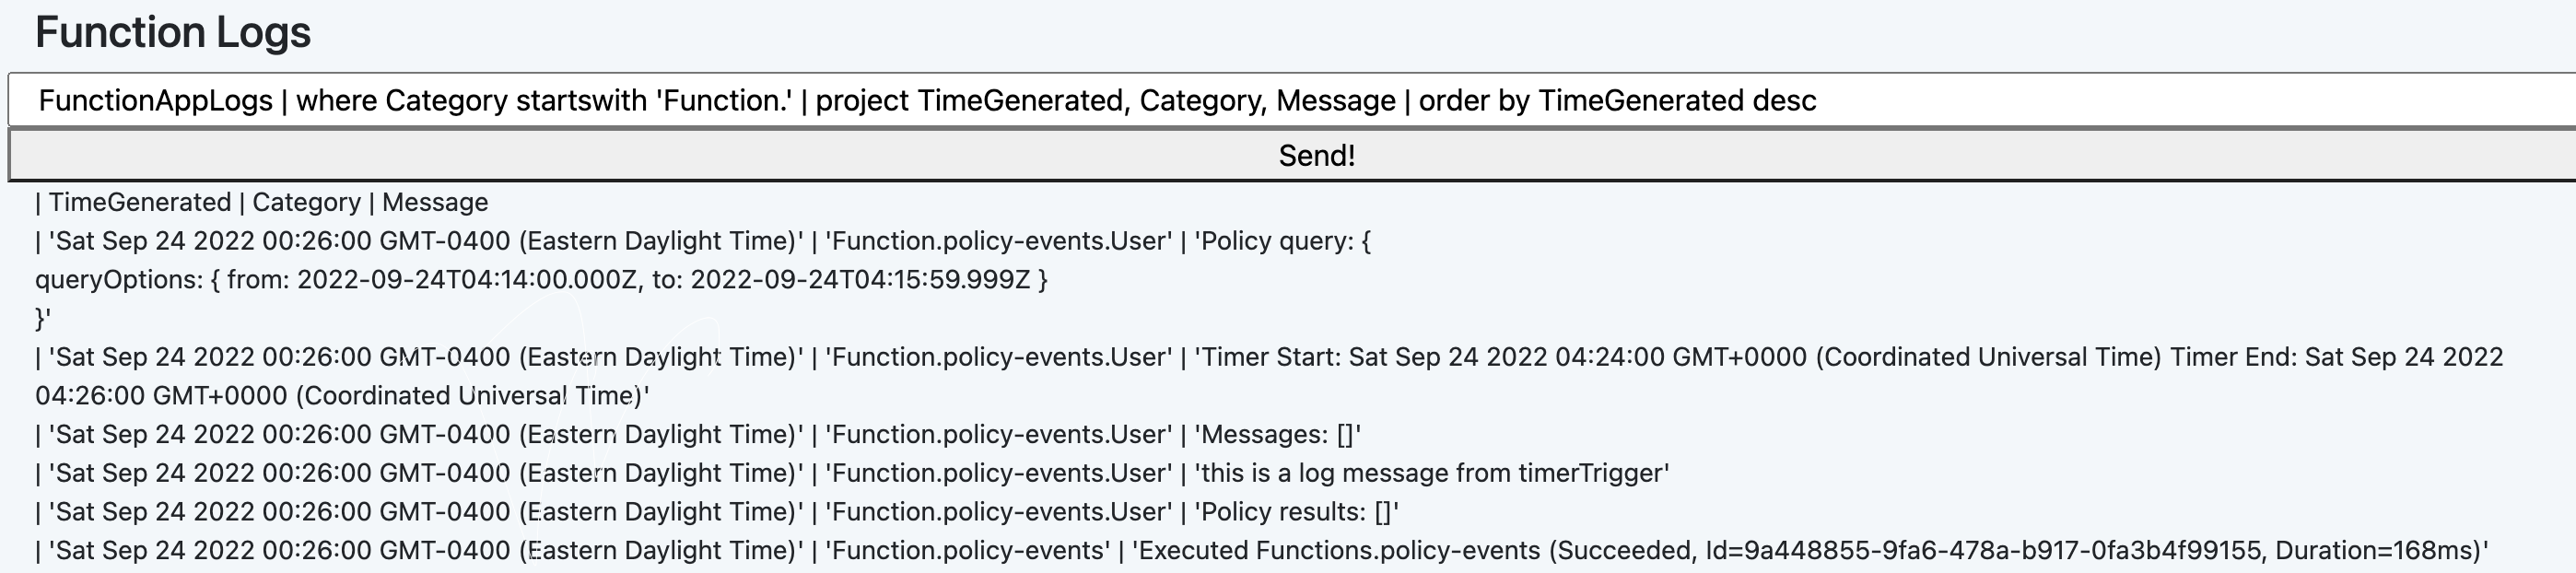
You can see that the UI is not really there yet, that'll be my next task.